Welcome to the third and final part of this series that focuses on application performance. To recap, part 1 outlined a high-level process for dealing with performance concerns. Part 2 showed how important xas requests are and how to improve page load times by reducing their number.
The focus in this part will not be on eliminating requests, but rather on deciding when and where to run logic that is needed when opening a page.
Do you remember the sample application from the last post? As a reminder, it was an app that supports the planning of tasks per different resources. In the last post, we managed to reduce the page load time from 5 seconds to 1.8 seconds by eliminating xas queries. This was done by either grouping requests or replacing microflow calls them with nanoflows.
Exhibit A
Next, we continued by running another APM analysis of the page load time. The analysis showed that almost half the page load time (750 milliseconds) was spent in a single microfow named CalculateChartValues. That was the next obvious target for optimization.
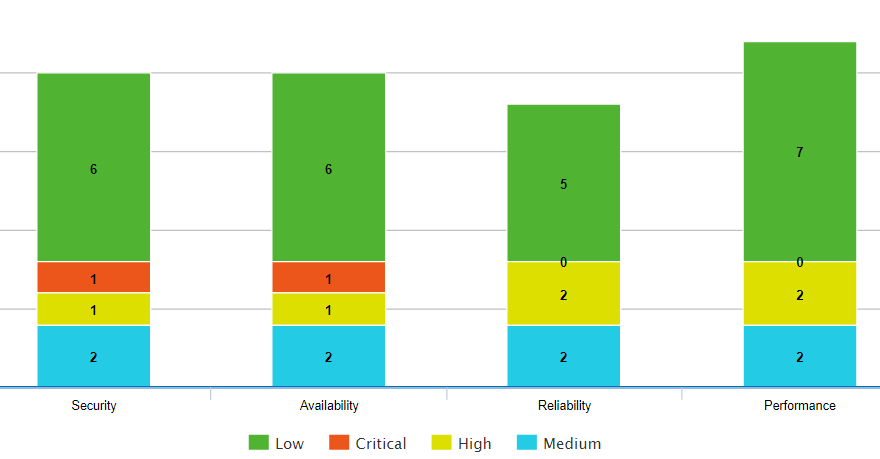
The microflow CalculateChartValues aggregated the number of tasks by category and priority. The data was then presented in a nice chart¹ like so
Let's inspect the open page microflow. It uses an NPE as a container object, and a lot of information is attached to this NPE, including the chart value.
 Main open page microflow.
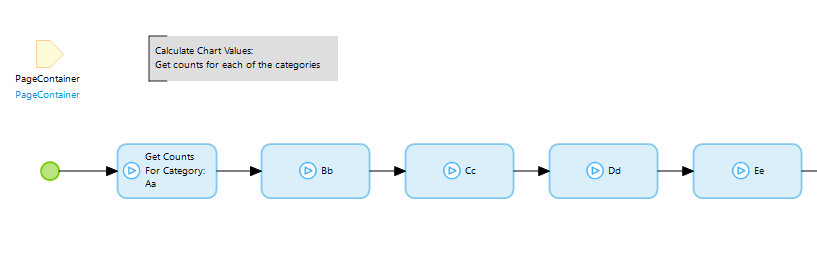 Each action calls the same microflow (below) but with different arguments
 Each action call calls the same microflow (below) but with different arguments
And finally at the bottom of the call stack:
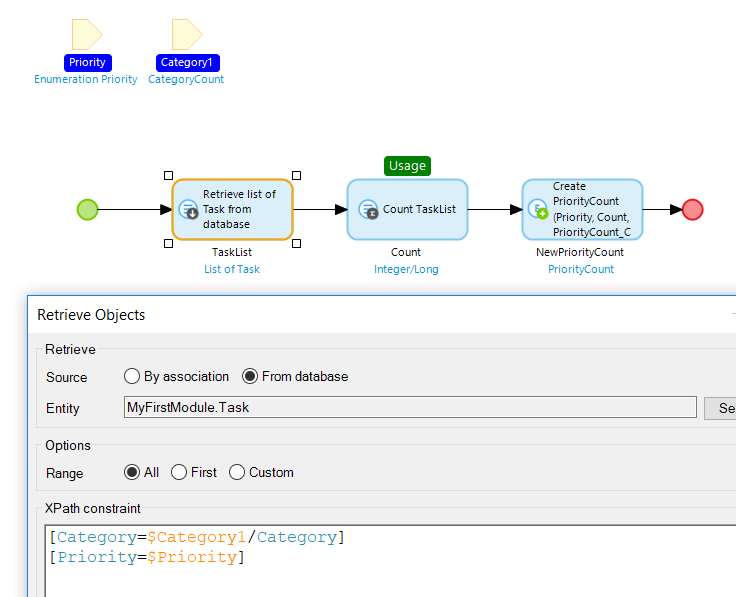
The code is tidy and organized. There are no obvious performance red flags such as commits inside loops or slow retrieves. On the contrary, the database retrieve is followed nicely by an aggregate function. This is a well-known optimization technique in Mendix and the query in question took only 5-10 ms on average. That time would be hard to improve upon. Indexes would probably not help, and might even make things slightly worse².
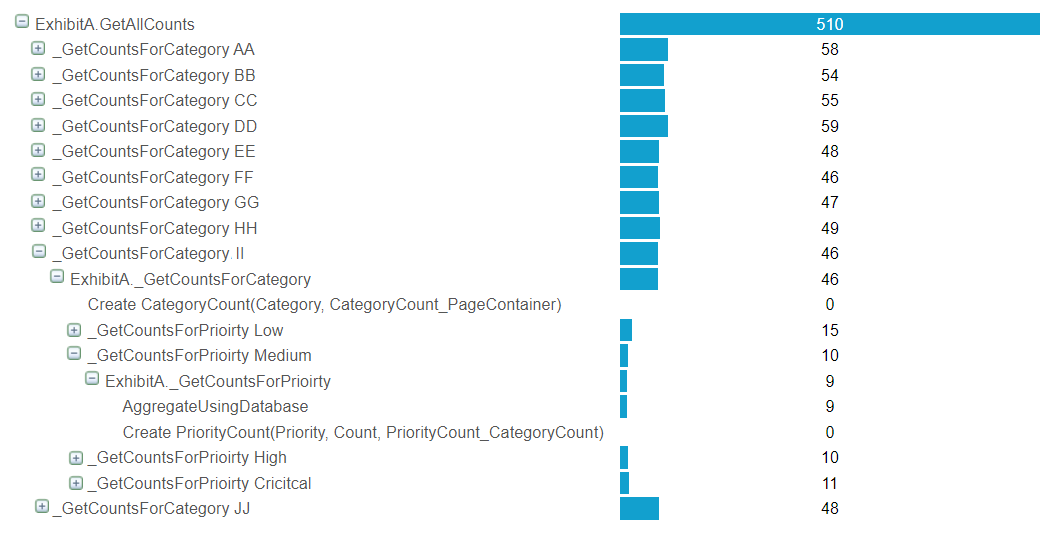
Each retrieve+count is taking 10 milliseconds. In total this added up to 500 milliseconds.
But when we look at the APM measurements the root cause for the long duration becomes obvious. Note that there are 10 different categories. Multiply this by 4 different priorities and we get a total of 40 combinations. The retrieve+aggregate although generally a good practice, was making things really slow. In this case, it would be much better if all the tasks are retrieved once at the start and then counted using a combination of filter+aggregate as shown below
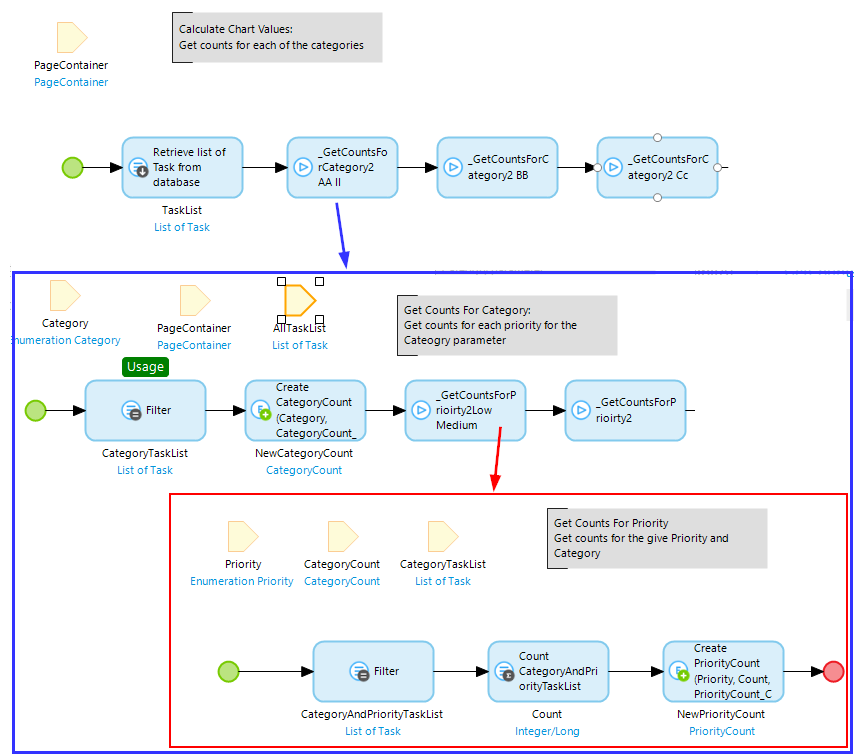 Replaced retrieve+aggregate construct with filter+aggregate
By running this new version through APM we see an incredible speed up. The microflow execution time drops from 500 ms to 17 ms³.
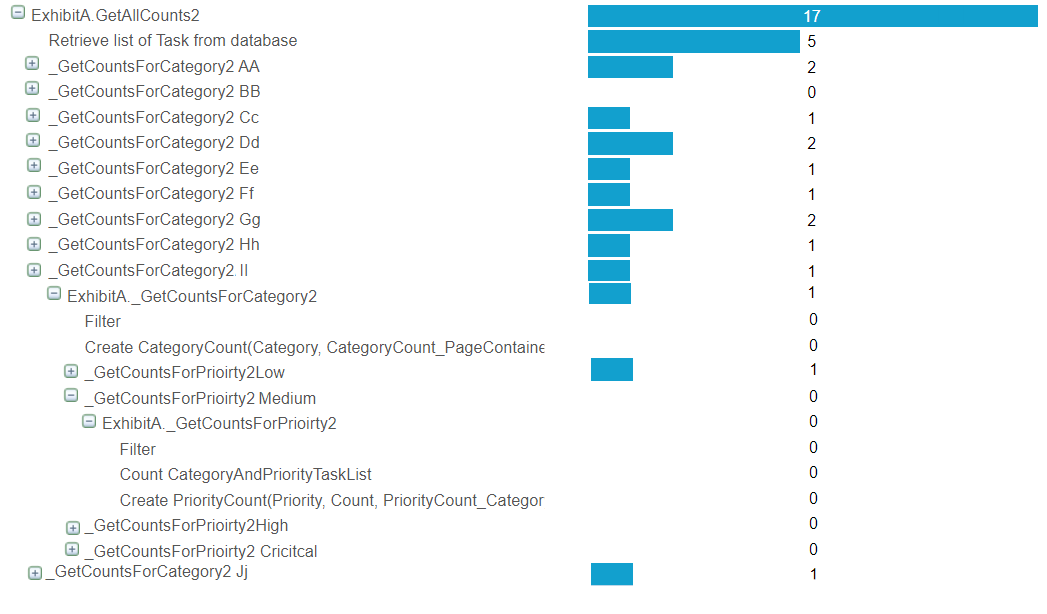 By retrieving at the very start and then using filter+count the total time dropped to just 17 milliseconds.
Now you are probably thinking that it is not possible to go lower than 17 milliseconds.
But, what if the chart values are not calculated at all when opening the page. What if the chart values are calculated in advance and stored in the database. In that case, when the page is opened the chart values only need to be retrieved from the database.
There are two main way to go about storing calculated values in the database:
- Use object events (before/after commit/delete) to keep track of any changes, or
- Periodically re-calculate the values
Clearly option 2 does not give accurate statistics all the time⁴, but it is much easier to implement and is less likely to cause additional performance concerns elsewhere in the app (where the objects are committed/deleted). Also, with option 2 we can happily reuse our microflow for calculating the chart values so the chances of introducing an error are smaller. The end result:
 The fastest option is not to calculate anything at all and instead retrieve pre-calculated values from the database.
Now that is a nice speedup, wouldn't you agree. This exhibit illustrates how performance can be improved by shifting the time of execution. Instead of calculating values when a page is opened, those values can be calculated beforehand and stored in the database. This is an excellent approach for improving page load time. Sometimes, however, it can be really hard to pull off as is the case in
Exhibit B
We all know that virtual attributes are bad for performance. They run every time when an object is retrieved regardless if the attribute is needed or not. So we cringed when we saw that the most executed microflow on the server was one for virtual attributes.
 In addition to profiling microflows, APM gathers statistics on the number and duration of all microflow executions. This statistic makes it easy to figure out what are the most time-consuming microflows.
At first glance, this looked like an easy win, because refactoring the use of virtual attributes is really simple: precalculate them in a before or after commit event and store them as a normal attribute. However, in this case, that was not possible. It turns out that, the virtual attribute was showing a user-friendly string of the relative time from when a task was finished:
 Obviously, this could not be done in a before commit event because the string needs to change all the time. Another alternative would be to use a scheduled event, but that would probably be even more inefficient as values will be updated all the time even when they are not needed at all.
The solution became clear when we figured out that the string was not used in excel or rest calls, but only on two pages. Instead of calculating a string value in a microflow, we could build a small custom widget that shows the relative time. This was reasonably easy to do. It turned out, that we didn't even have to do that as the format string widget already has this option.
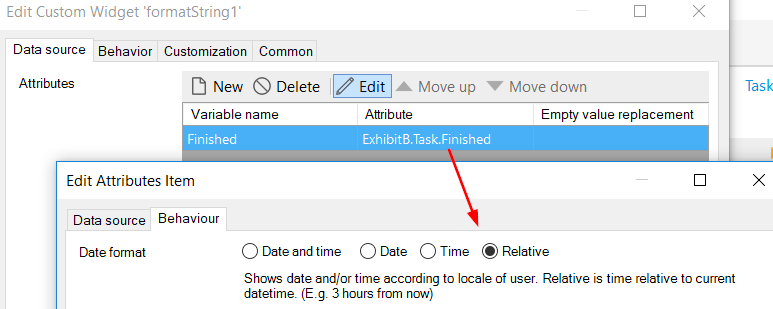
With this final optimization in place, the page load time of the task application was finally below 1 second. Don't forget, at the start, the page took on average 5 seconds to load.
This performance issue perfectly illustrates the conflict between performance and maintainability. Building a widget or customizing an existing one might seem like only an hour or two of work. But what if the customized widget gets a new version with some critical bug fix or a great new feature. More time has to be spent porting the customization again. If there is a change in the Mendix client API, this might completely break the application. Using custom widget (or customized app store widget) might offer better performance, but that comes at the cost of more maintenance effort.
That concludes the exhibits. You can download the source code from the Mendix app store.
Summary
To summarize, in this series first, we discussed when and how to approach performance concerns. Then we looked at xas queries and some tricks on how the number of such queries can be reduced. Finally, in this post, we saw how load times could be reduced by shifting the computation in both space and time (calculate in custom widget instead of a microflow and precalculate).
Thanks for taking the time to read this blog post, and I hope it helps you develop faster apps!
Further reading
This is the final post in the series but if you want to learn more about performance, here is an incomplete list of other great resources on this topic:
- A great webinar by Danielle:
https://ww2.mendix.com/Expert-Webinar.Performance.html - The official guide from Mendix:
https://docs.mendix.com/howto/general/community-best-practices-for-app-performance - Two great posts from Mendix:
https://www.mendix.com/blog/3-ways-improve-performance-mendix-apps/ https://www.mendix.com/blog/microflow-improvements/ - Two great posts from Bart Tolen, the creator of APM:
https://www.mansystems.com/blog/performance-management/just-in-time-performance-management
https://www.mansystems.com/blog/mendix/top-10-performance-improvement-tips-for-mendix
¹In the attached samples, I reproduced the same conditions from the original app, but I replaced the chart with a simple table. This choice of representation is not relevant to the performance optimizations that are done.
²Adding an index to a database does not always improve performance as described nicely in this article.
³It would be fair to mention that in this simplified example, the entities have only a few attributes and associations. The speedup in real-world situations would probably be less dramatic. Finally, when retrieving objects in bulk like this, one also needs to consider if the result will fit in memory. This can be problematic if there are many or large attributes or lots of objects.
⁴As developers, we need to make sure that it is acceptable for the precalculated values to be slightly inaccurate when using this method. In addition, this has to be communicated to the user (e.g., by showing a message) to avoid any confusion. In some cases, if real-time numbers are needed you can add a refresh button that triggers a recalculation on demand.


