Building applications is hard. Building fast applications is even harder.
Why do we even care about speed?
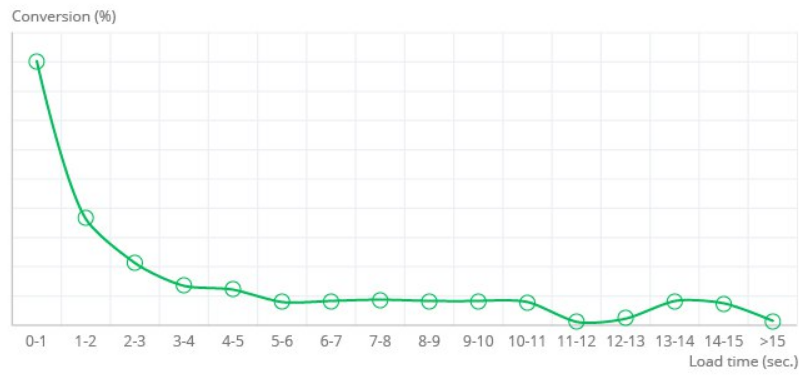
The reason could not be simpler: Faster applications have higher chances of attracting and retaining users¹. Below is a nice chart the shows how user conversions drop as response times increase.
User conversation rates drop off sharply as page load time goes up. Based on real data from Walmart. The actual conversion rates are unknown thus the missing axis, but the relative proportions are exact. Credits to https://www.webloungedesign.com/development/how-and-why-to-optimize-the-image-on-the-site/
Some of you might argue: I don't have to worry about conversion rates, mine is a business process application, my users have no choice, they have to use it. Apart from the users having an awful experience (which is a reason enough IOP), one also has to consider the time and costs of the user, or in this case the employees. For example, if a clicking a button or opening a page takes 10 seconds and a user does it 100 times a day, then 15 minutes of the day is wasted in waiting.
But that's not the end of it. There have been many studies which show that if users are frequently waiting for longer times (typically over 5 seconds) they are likely to switch to doing something else while waiting (e.g. checking phone). The probability increases the longer the users have to wait. By the time users are back to check on the progress a minute or two might have elapsed. This can easily turn 10 seconds to a minute and 15 minutes to 90 minutes a day wasted because the application is slow to respond.
How to build a fast Mendix application?
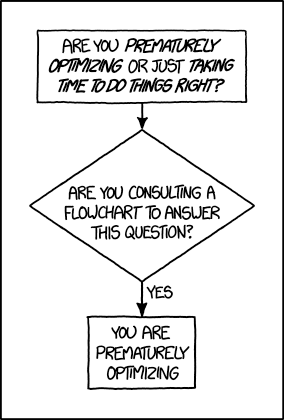
The simple answer is: You don't. This might seem contradictory considering how I just explained that speed is very important, but hear me out. Speed is important but that does not mean it has to be part of every user story. The simple reason is that during development it is hard to predict which parts of the application will be slow. It has been shown, time and time again that programmers are terrible at predicting performance bottlenecks.
That is completely understandable if we consider that most applications today are built on top of a complex ecosystem with multiple "black-box-like" layers of abstraction and extensions. Furthermore, it is virtually impossible to predict how performant a certain design will be in the real world using real data. The only way to say anything about performance with certainty is to deploy the solution and measure the performance in the real world.
 Credits to https://xkcd.com/1691/
Even if programmers could somehow predict performance issues it still might be a bad idea to spend time optimizing during regular development. To repeat a quote that all programmers probably know already: Premature optimization is the root of all evil. One of the main reasons for this is that performance optimizations introduce complexity in the application.
Over time as the application grows, more and more premature optimization is implemented. This makes it progressively harder to maintain the existing code and add new features to the app. In other words, the complexity that arises due to performance optimizations, starts to conflict with other software quality metrics such as maintainability, testability, usability and other bilities. So now we have a classical dilemma, the application needs to be fast and therefore needs to have performance optimizations, but at the same time optimizations hurt our ability to maintain the application and add new features.
The solution...
is to avoid premature optimization on gut feeling alone. Instead, deploy the application and measure the performance with real data and real users. Based on the measurements pick the most used and slowest parts of the application and optimize those. As is common in many activities, the 80/20 rule applies here as well, i.e. it is likely possible to remove most (80%) of the performance problems with only a small effort (20%).
Since the performance optimizations are based on real data and only implemented where really necessary, the amount of complexity introduced in the application is kept to a minimum.
How to measure the performance of a Mendix application?
As mentioned before the performance measurements need to be done under real conditions with a control group of users or with all the users. You need to monitor what the users are doing and how long it takes to load pages and process clicks. Based on this data you can prioritize which pages and microflows to optimize first. Remember that we are looking for activities that take a long time to complete, but also activities that happen often.
For example, an excel upload that takes 30 seconds sounds terrible. But if it only happens once per day then the most you can save by optimizing it is 30 seconds. In most cases, this is not worth the development effort. On the other hand, if opening a certain page takes 3 seconds, but it happens 1000 times per day then it is probably worthwhile to invest some effort and bring the loading time down. If the developers manage to drop the loading time down to 1 second, then the total savings are more than 30 minutes per day!
So what you want to measure is: duration of microflows and page loads as well as the number of times the microflow is called or the page is loaded. It would be even better if one can see directly how much each action in a microflow and each widget in a page contributes to the response time.
Tools
There are many ways to monitor performance for a web application. The simplest way is to manually add log statements. Clearly, this does not scale well and pollutes the code with distracting log statements. A better way is to use a tool for monitoring. Mendix is java based so tools for monitoring java also work for Mendix application. Such tools include JMX, AppDynamics and NewRelic. However, these tools work on the low java level of functions and classes and it takes extra effort to relate the metrics to the Mendix level of microflows and pages.

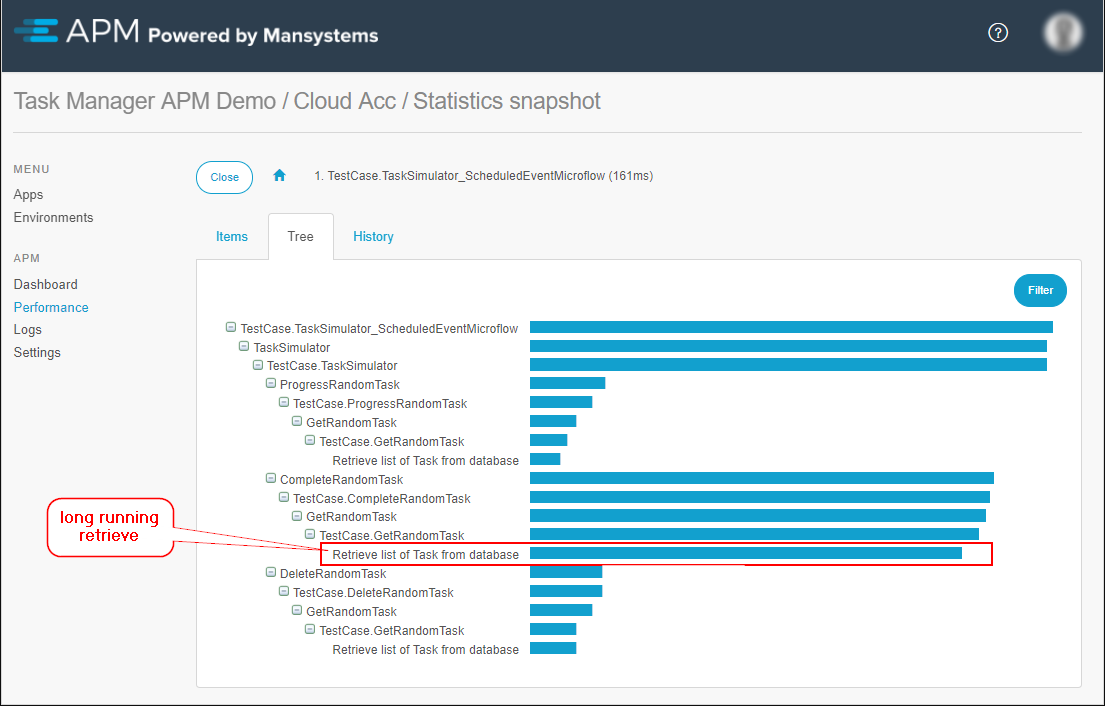
Another option is to use APM a performance monitoring tool built specifically for the Mendix platform. Out of the box APM gathers and reports metrics on the load times for pages and microflows (average, total and 90 percentile²) as well as numbers of execution. On top of that, it shows the duration of each action in a microflow and each HTTP call while opening a page. All this information is organized and presented logically on the Mendix level of pages, widgets, microflows and actions. This makes it extremely easy to determine which parts of your application are having performance issues.
Summary
This blog post is a part of a series focused on performance. It presents a high-level process for handling performance concerns in a Mendix application. It also outlines how and what metrics to gather to best diagnose performance problems.
In the next two posts, we will look into concrete performance problems in a Mendix application. I will show you how to detect performance bottlenecks and how to fix them.
To be continued...


