Following the recent release of ATS 2, it is now time for the next major unveiling of another productivity tool- APM 2. Similarly to ATS 2, we have prioritized a new look for this productivity model. This release features a new structure as well as a strong focus on user experience, two key aspects that we wanted to emphasize and since we are still an end-user too, we added some pretty neat features!
APM Manager and APM Agent
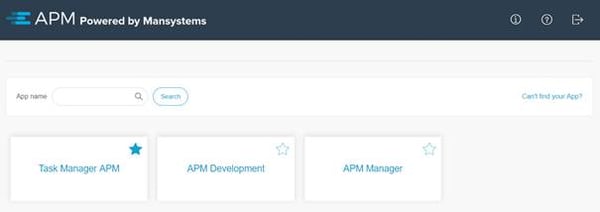
The most significant architectural change is likely the new way APM Manager and APM Agent are setup. The APM Manager in APM 2 is now a cloud-based, multi-tenant application, integrated with the Mendix Cloud Portal (http://home.mendix.com) to provide single-sign-in with your Mendix ID. With that, your APM licensed apps will also be shared automatically.
The most significant advantages to this cloud solution are these:
- There is now one APM Manager to manage the performance of all your applications.
- The APM Manager does not have a UI in your app and does not need permissions or
- The APM Agent no longer utilizes your app database to store traces.
- This version of APM agent has even less of an impact on your app than
- New features within the APM Manager become available quickly and does not require a deployment of your own app.
- Setting up APM for your apps has never been easier.
Simplified UI and functionality
As mentioned in one of our earlier blogs, we want our add-ons to increasingly integrate more smoothly with the Mendix platform. Through implementing a familiar face and a familiar UX, just like the Mendix Cloud Portal (http://home.mendix.com), we can provide a seamless experience. That overhaul motivated us to revise the whole APM Manager, simplifying the user flows and ease of use. To accommodate that, a tour guide has been added to lead inexperienced users through various usage scenarios, helping them to perform specific jobs.
In addition, we added defaults for many settings that overwhelming remained unchanged and limited some configuration options to a more end-user friendly understandable setting such as ‘High’, ‘Medium’, or ‘Low’.
To summarize the most important simplifications:
- A tour guide has been added to help you use APM to perform specific jobs.
- Many settings that were never changed now possess a proper default.
- Some technical settings have been combined into an end-user understandable setting such as memory-usage high, medium, or low.
- The former log tool and trap tool are combined into the logs.
- The recorder now stores immediately so, recording is simply a start/stop function and no longer needs processing.
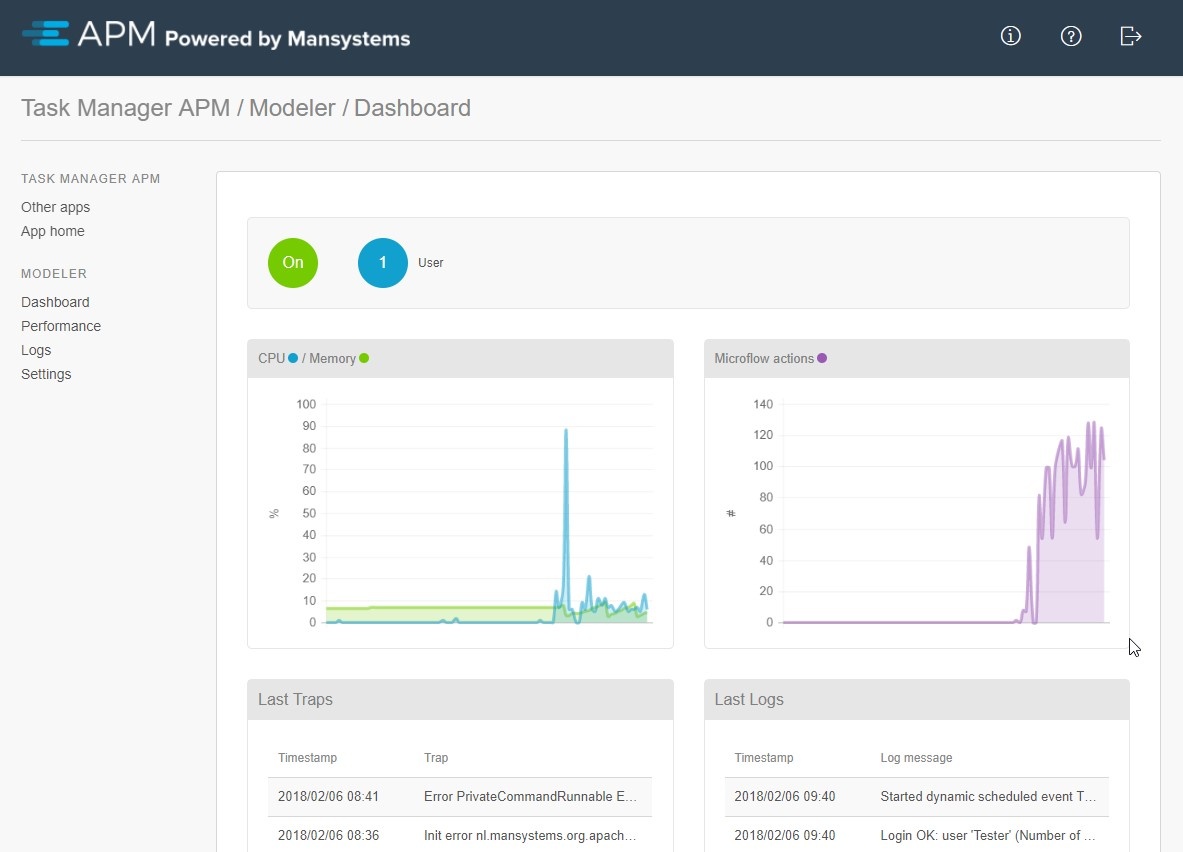
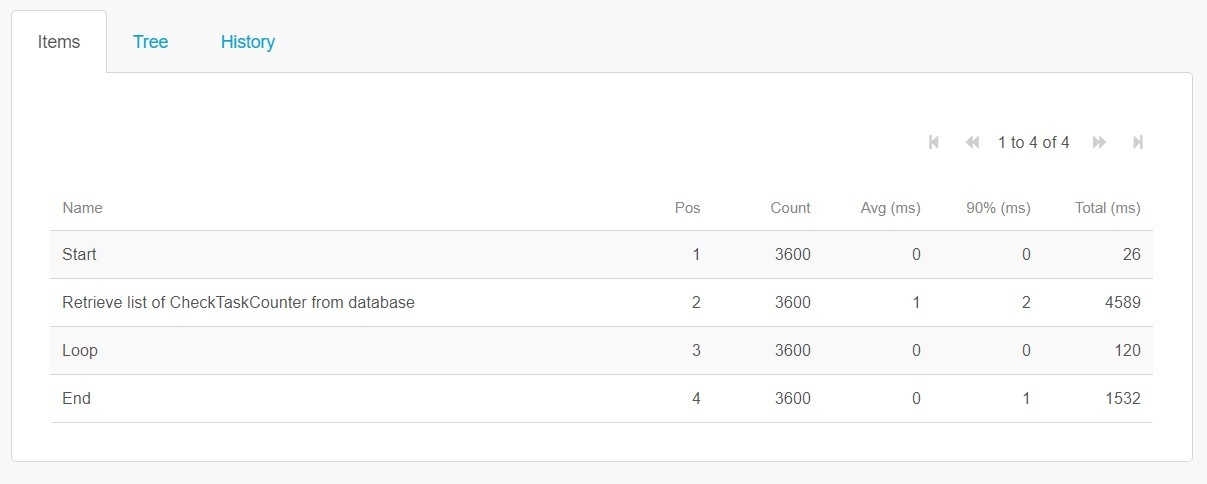
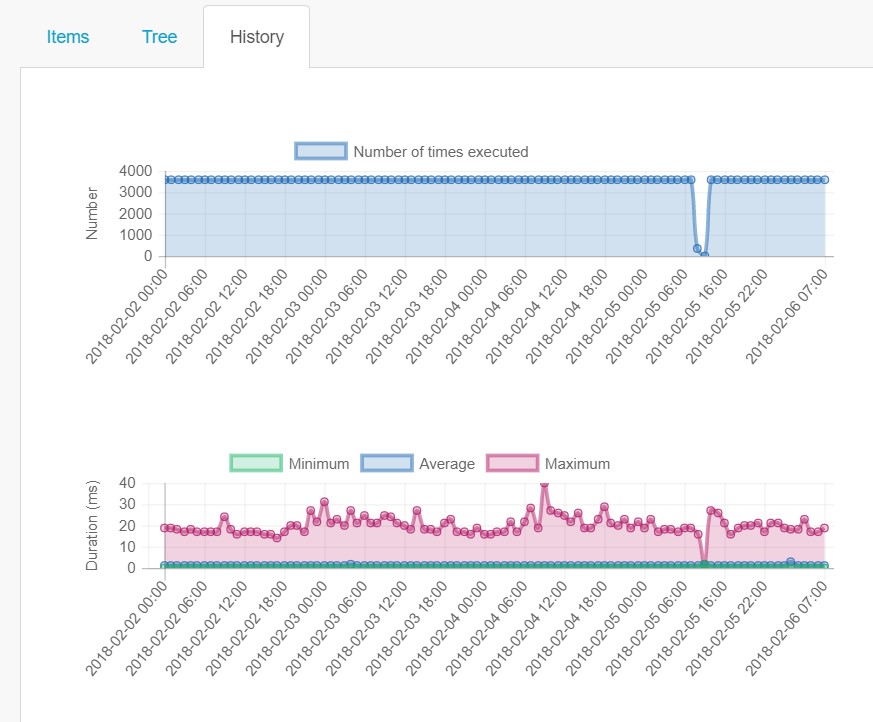
Another great feature is that the statistics collector now also stores action statistics as well. This will give detailed insights in microflows and actions without recording at all so, in most cases you are able to just look at the statistics and start fixing!

End-user measurements
When analyzing performance issues, there are many layers in your infrastructure that you must take into consideration. With the introduction of the APM Browser Agent it is possible to measure performance from the browser side. Measuring real end-user experiences allows you to grasp the actual end-user experience and not miss out on performance issues caused by the network, a slow browser, or Apps that are too chatty or send too much data.
The APM Browser Agent now collects statistics and can even record individual traces, all controlled from the central APM Manager. The APM Browser Agent can run in browsers, on mobile devices, and Mendix native PhoneGap apps.
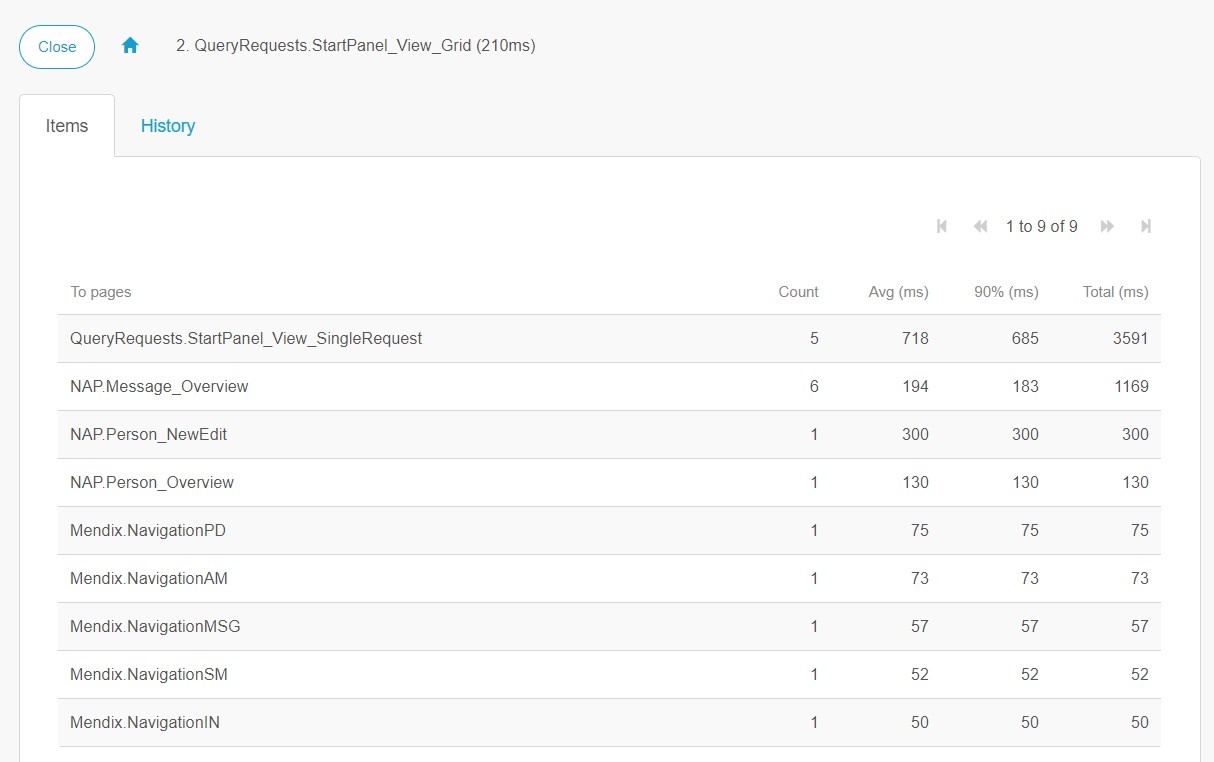
An additional inventive feature is that the Browser Agent statistics is even capable of showing click-paths. This is an initial version of a feature that shows huge potential in seeing how your application is really used! Below, you can see a screenshot of the clicks from the start panel. You can dive into each clicked item to follow the path further.
